


India Investment Intelligence 2026
1,700+ GCCs Driving the $64.6B Global Capability Economy
The data behind capital flows, sector momentum, and structural shifts shaping the next decade. 100+ verified data points from IMF, NASSCOM, RBI, and DPIIT.
The Numbers That Define India's Investment Moment
Sixteen headline indicators drawn from institutional sources across macroeconomics, capital markets, technology, and infrastructure.
The Structural Shifts Driving Capital to India
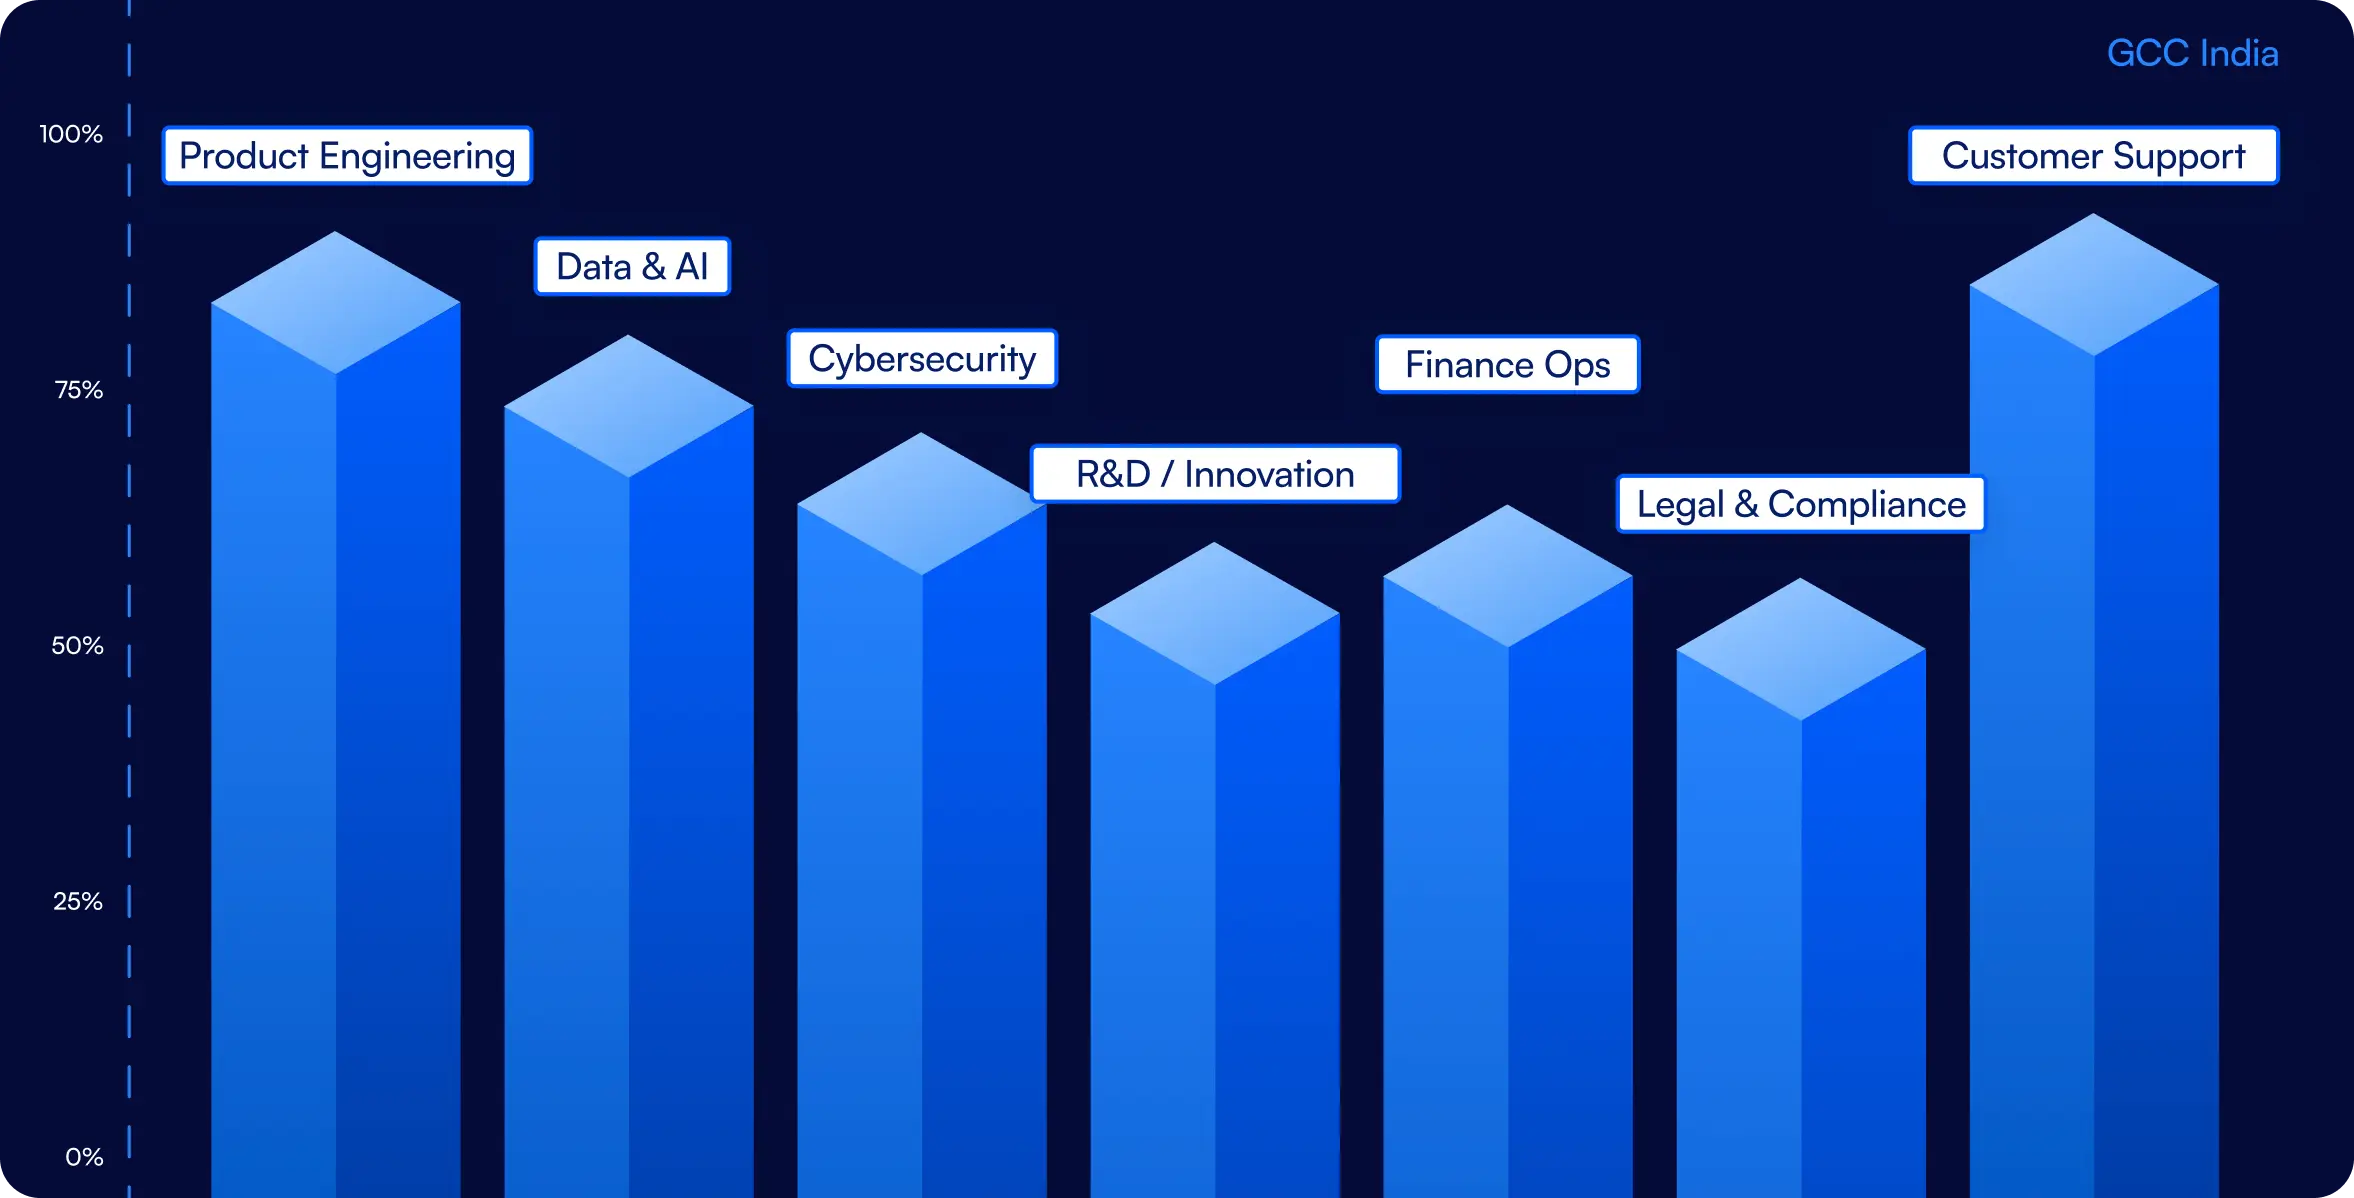
GCC Ecosystem
India's 1,700+ Global Capability Centers employ 1.9 million professionals and generate $64.6 billion in revenue. Over 90% now operate as multi-functional innovation hubs. 70% have defined AI roadmaps.
Capital Flows
$81 billion in FDI, $43 billion in PE/VC investment, and $20.5 billion in IPO capital raised — all flowing simultaneously.
AI & Talent
5.95 million tech professionals with over 2 million AI-upskilled. India's IT majors are training workforces of 300,000–600,000 on AI at an unprecedented pace.
Macroeconomic Stability
GDP growth at 7.3% (IMF, Jan 2026) — the fastest-growing major economy for the fourth consecutive year.
From Cost Centers to the Strategic Nerve Center of Global Corporations
What the Report Covers
A structured research briefing across 10 sections with verified data, analytical narrative, and publication-quality charts.
Macroeconomic Foundation
GDP trajectory, fiscal position, forex reserves, credit outlook, and India's standing relative to global peers.
Capital Flow Analysis
FDI trends by sector and origin, PE/VC deal volumes, IPO activity, and portfolio investment dynamics.
GCC Ecosystem
Scale, revenue trajectory, city distribution, the innovation shift, AI capabilities, and 2030 projections.
Talent and Workforce
STEM output, IT workforce composition, salary benchmarking across geographies, and demographic advantage.
Sector Opportunities
Technology, digital payments, PLI-driven manufacturing, clean energy capacity, and the AI infrastructure buildout.
Strategic Implications
Tailored analysis for venture capital, private equity, institutional allocators, and companies building teams in India.
Get the Full Report
The complete India Investment Intelligence 2026 research report with 100+ verified data points, analytical narrative, and publication-quality charts.
- 14 charts with institutional data
- Macroeconomic, capital flow, and sector analysis
- GCC ecosystem deep dive with 2030 projections
- Talent benchmarking and demographic analysis
All data sourced from institutional publications including IMF, World Bank, RBI, DPIIT, NASSCOM, SEBI, MNRE, NPCI, and Bain & Company / IVCA. Data vintage ranges from FY2024–25 actuals to January–February 2026 updates. Indian fiscal years run April to March.
Ready to Build Your India Strategy?
Wisemonk is an India-focused Employer of Record helping global companies hire and manage teams in India.