India Investment Intelligence 2026
The data behind capital flows, sector momentum, and structural shifts shaping the next decade. 100+ verified data points from IMF, NASSCOM, RBI, and DPIIT.
1,700+ GCCs Driving the $64.6B Global Capability Economy
India at a Glance
The Numbers That Define India's Investment Moment
Sixteen headline indicators drawn from institutional sources across macroeconomics, capital markets, technology, and infrastructure.
7.3%
GDP Growth FY2026
$81B
FDI Inflows FY2025
$43B
PE/VC Investment 2024
$728B
Forex Reserves
1,700+
GCCs in India
$315B
IT/BPM Revenue FY26
5.95M
Tech Workforce
$5.2T
Market Capitalization
228B
UPI Transactions / Year
247 GW
RE Installed Capacity
$20B+
PLI Investment Realized
1.26M
PLI Jobs Created
#2
Global IPO Market
2.5M+
STEM Graduates / Year
51%+
Non-fossil Power Share
$1.14T
Cumulative FDI Since 2000
Report Highlights
The Structural Shifts Driving Capital to India
The report identifies four converging forces reshaping where global companies build, hire, and invest.
The GCC Ecosystem at Scale
India's 1,700+ Global Capability Centers employ 1.9 million professionals and generate $64.6 billion in revenue. Over 90% now operate as multi-functional innovation hubs. 70% have defined AI roadmaps. The ecosystem is projected to reach $99–105 billion in revenue by 2030 with 2.5–2.8 million professionals.
Capital Flowing on All Channels
$81 billion in FDI, $43 billion in PE/VC investment, and $20.5 billion in IPO capital raised - all flowing simultaneously. Manufacturing FDI grew 18% as supply chains diversify. VC deal volumes surged 45% with 1,270 deals in 2024. India's market capitalization doubled to $5.2 trillion in under five years.
The AI and Talent Advantage
5.95 million tech professionals with over 2 million AI-upskilled. India's IT majors are training workforces of 300,000–600,000 on AI at an unprecedented pace, building enterprise deployment capacity at a scale unavailable elsewhere at comparable cost. 2.5 million STEM graduates produced annually.
Macroeconomic Stability
GDP growth at 7.3% (IMF, Jan 2026) — the fastest-growing major economy for the fourth consecutive year. Government debt-to-GDP at 56.8% vs 124% for the US. Foreign exchange reserves at $728 billion covering 11 months of imports. Positive credit outlook from Moody's and S&P.
Global Capability Centers in India
From Cost Centers to the Strategic Nerve Center of Global Corporations
1,700+
GCCs operating in India
$64.6B
Annual revenue generated
1.9M
Professionals employed
45% of Global GCC Talent
India hosts nearly half of the world's entire GCC talent base, with revenue growing at 9.8% CAGR over the past four years and GCCs contributing over 1% of India's GDP.
$99–105B Revenue by 2030
Industry projections indicate the ecosystem will expand to 2,100–2,200 centers by 2030, with a workforce of 2.5–2.8 million professionals.
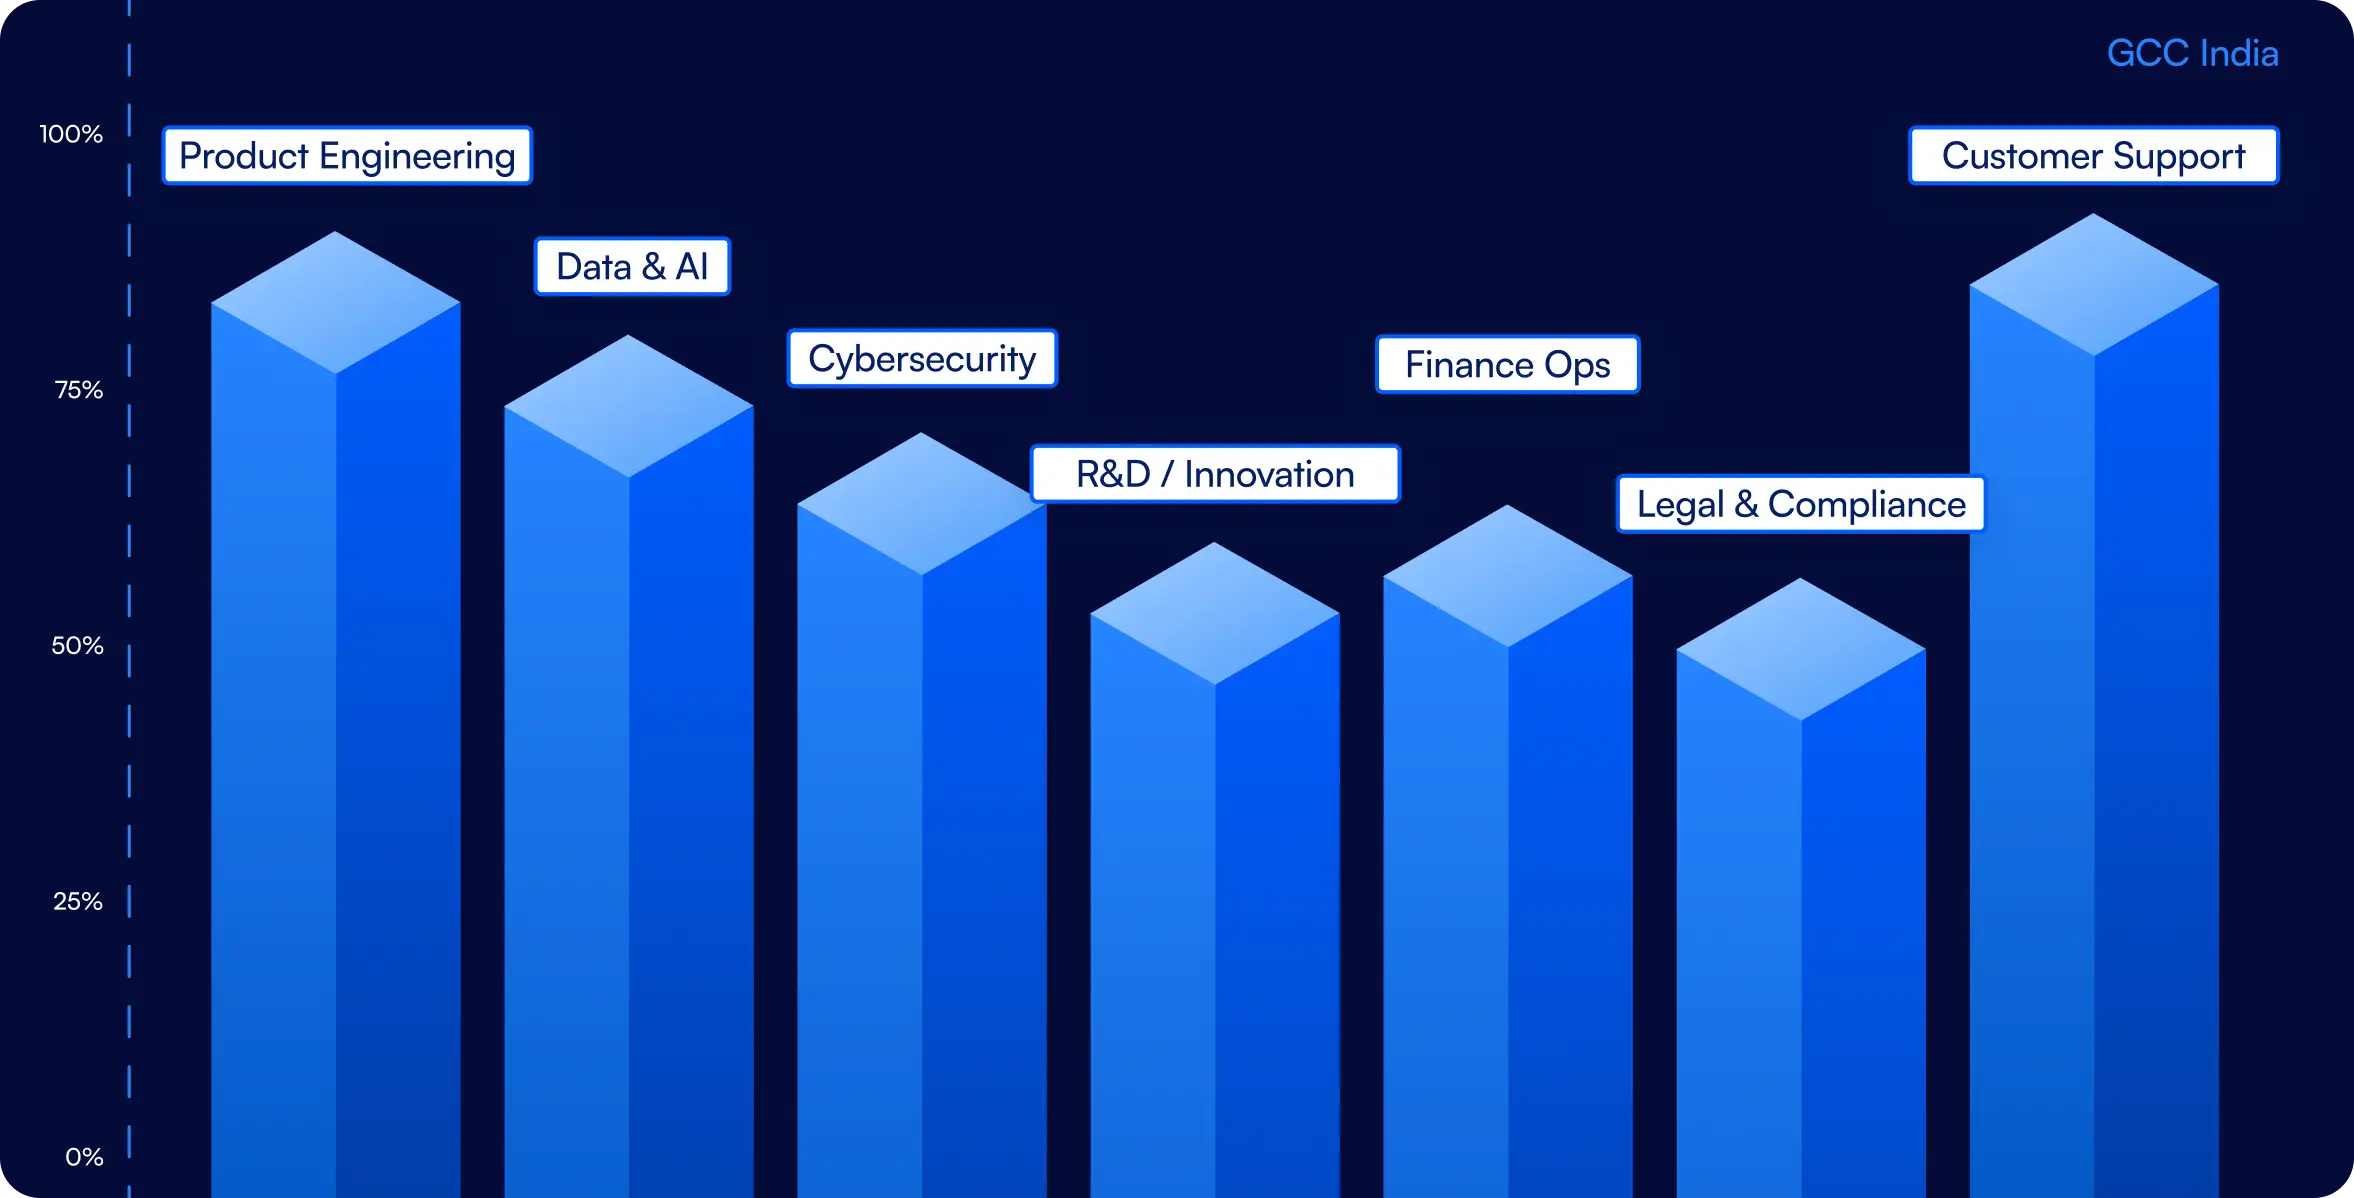
90%+ Multi-functional Hubs
Over 90% of GCCs now operate across technology, operations, and product engineering. More than half have evolved to portfolio and transformation hub status.
70% Have Defined AI Roadmaps
India houses 120,000+ AI/ML professionals across 185+ dedicated AI Centers of Excellence within GCCs. Engineering R&D GCCs have grown 1.3x faster than the overall ecosystem.
40% of Office Space Absorption
GCCs account for nearly 40% of India's total office space absorption. Annual GCC leasing is projected at nearly 30 million sq. ft. over the next six years.
Tier-2 Expansion Underway
Cities like Jaipur, Coimbatore, Ahmedabad, and Vizag are emerging as GCC destinations, offering 25–30% cost advantages over Tier-1 metros with growing talent pools.
Inside the Report
What the Report Covers
A structured research briefing across 10 sections with verified data, analytical narrative, and publication-quality charts.
Macroeconomic Foundation
GDP trajectory, fiscal position, forex reserves, credit outlook, and India's standing relative to global peers.
Capital Flow Analysis
FDI trends by sector and origin, PE/VC deal volumes, IPO activity, and portfolio investment dynamics.
GCC Ecosystem
Scale, revenue trajectory, city distribution, the innovation shift, AI capabilities, and 2030 projections.
Talent and Workforce
STEM output, IT workforce composition, salary benchmarking across geographies, and demographic advantage.
Sector Opportunities
Technology, digital payments, PLI-driven manufacturing, clean energy capacity, and the AI infrastructure buildout.
Strategic Implications
Tailored analysis for venture capital, private equity, institutional allocators, and companies building teams in India.
Methodology
All data sourced from institutional publications including IMF, World Bank, RBI, DPIIT, NASSCOM, SEBI, MNRE, NPCI, and Bain & Company / IVCA. Data vintage ranges from FY2024-25 actuals to January–February 2026 updates. Indian fiscal years run April to March.
IMF
World Bank
RBI
DPIIT
NASSCOM
SEBI
MNRE
NPCI
Bain & Company / IVCA
CBRE
Ready to Build Your India Strategy?
Wisemonk is an India-focused Employer of Record helping global companies hire and manage teams in India.